Culture Lab
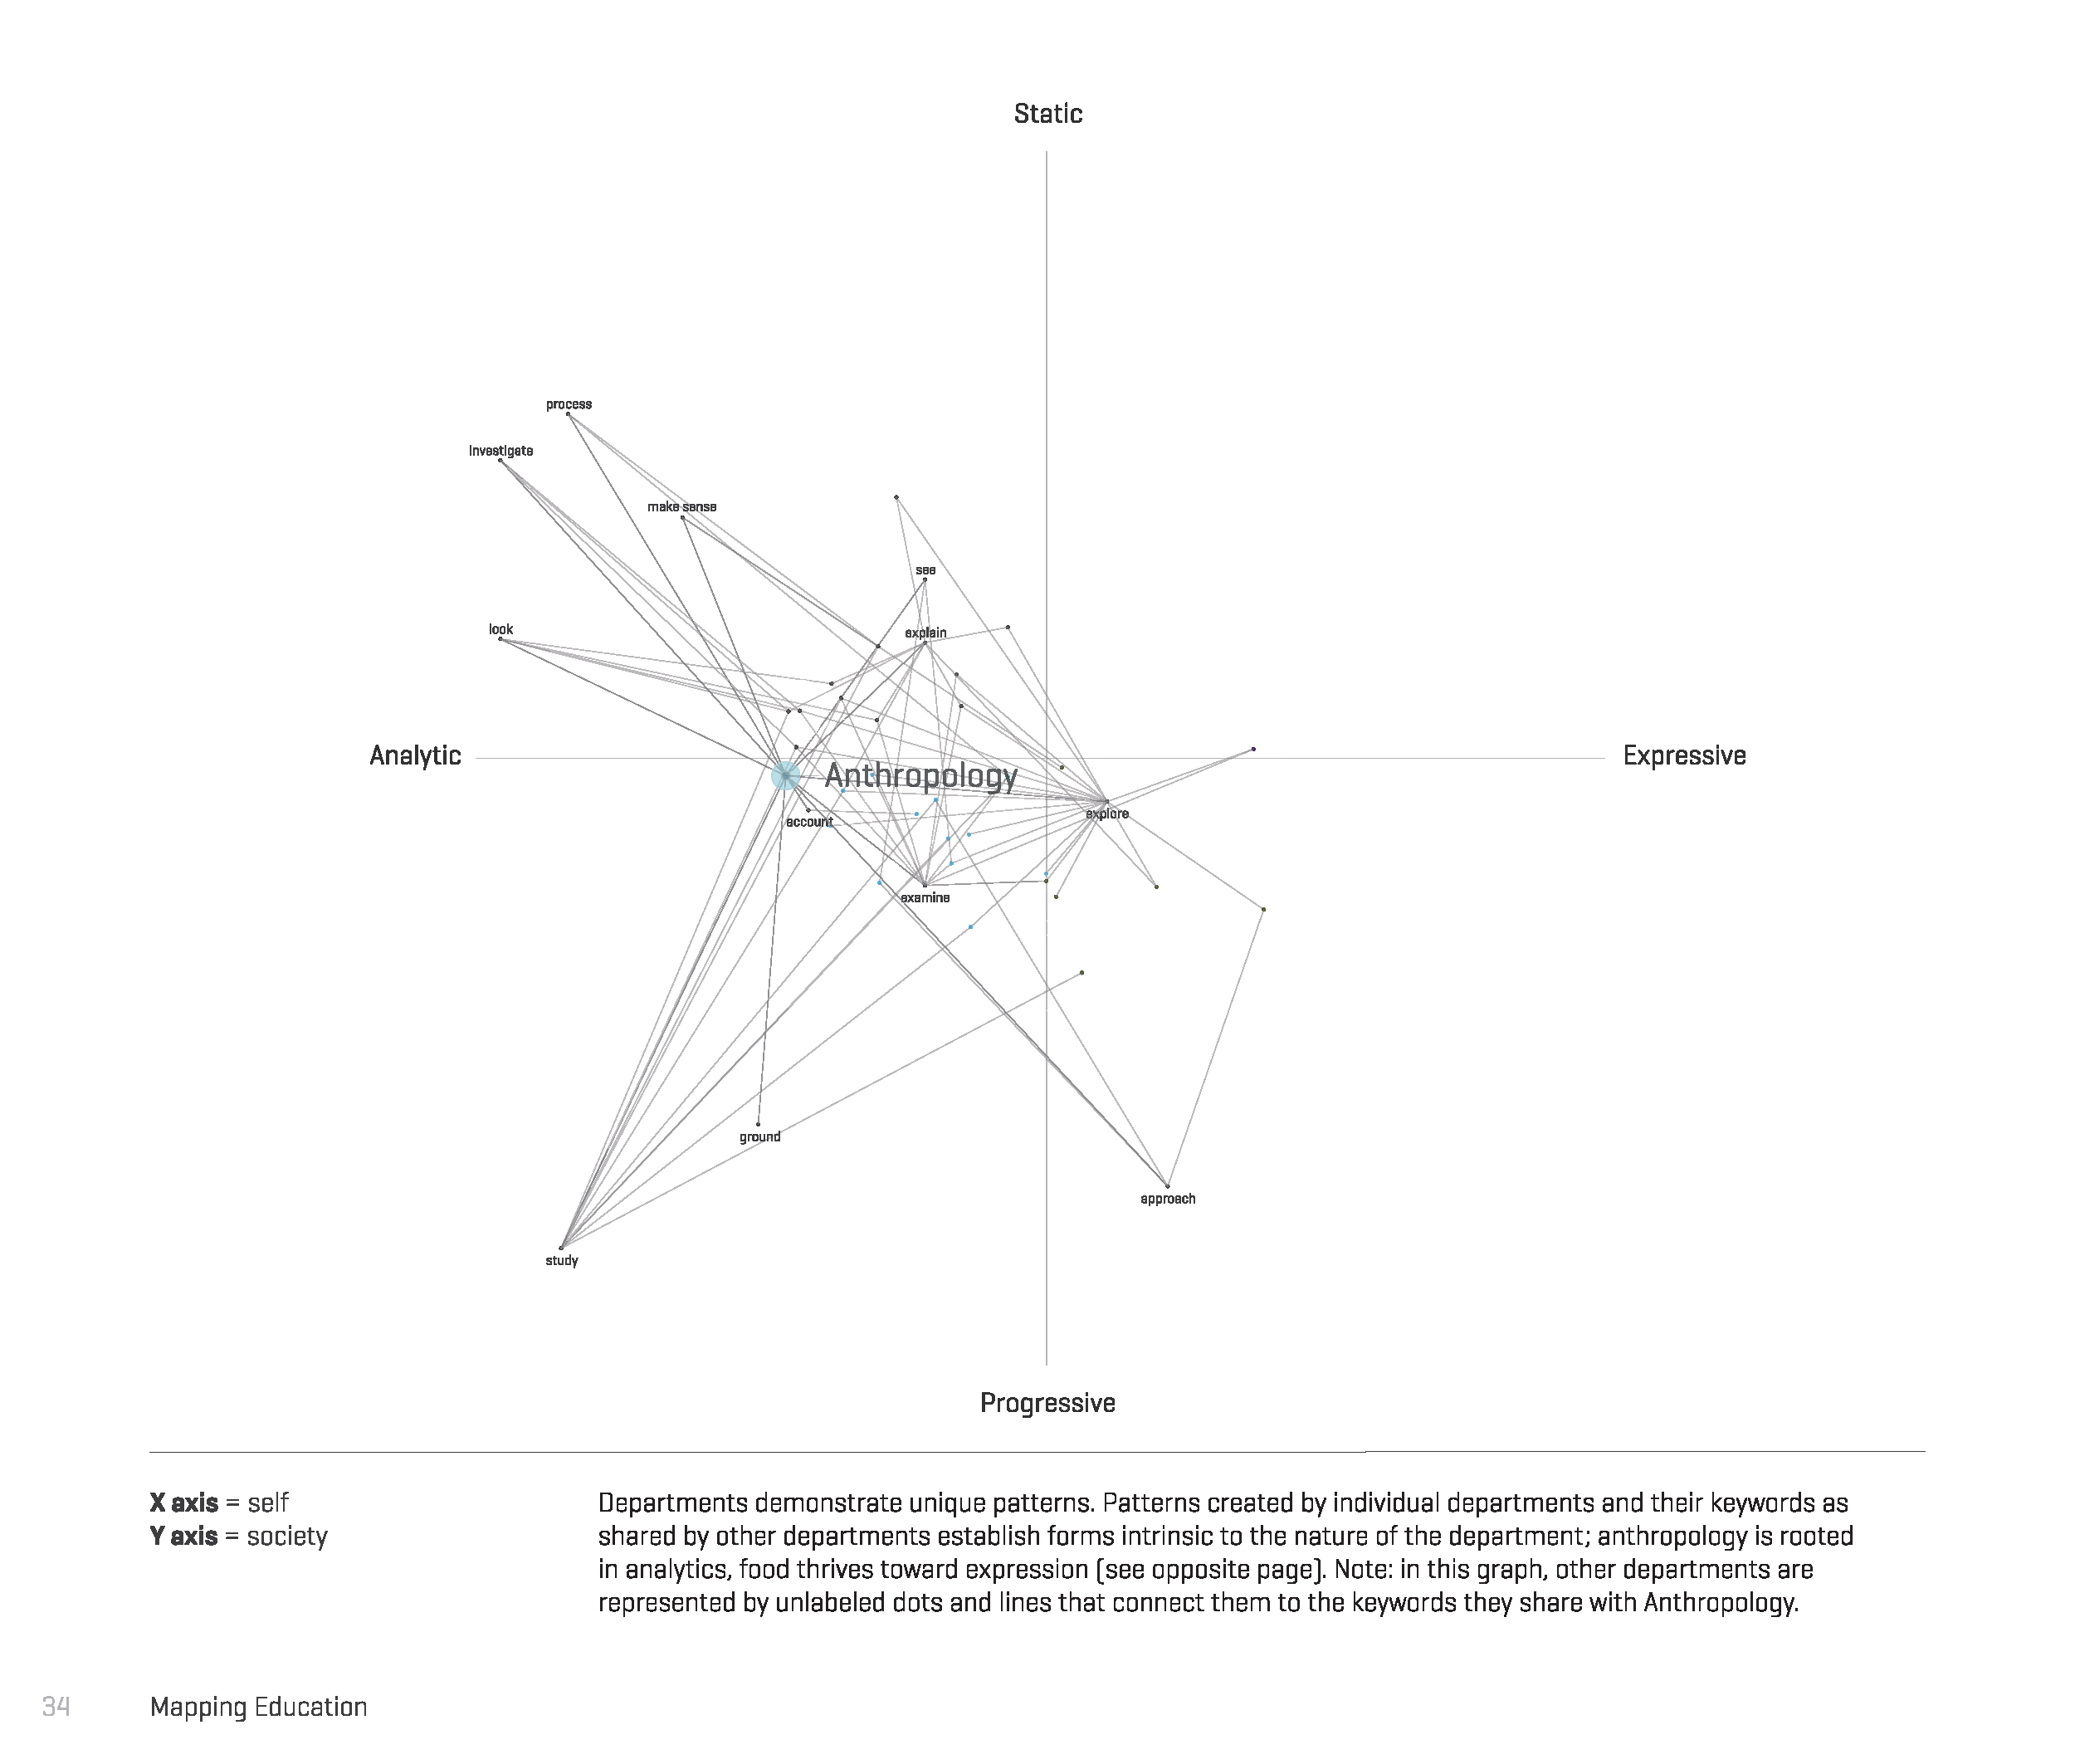
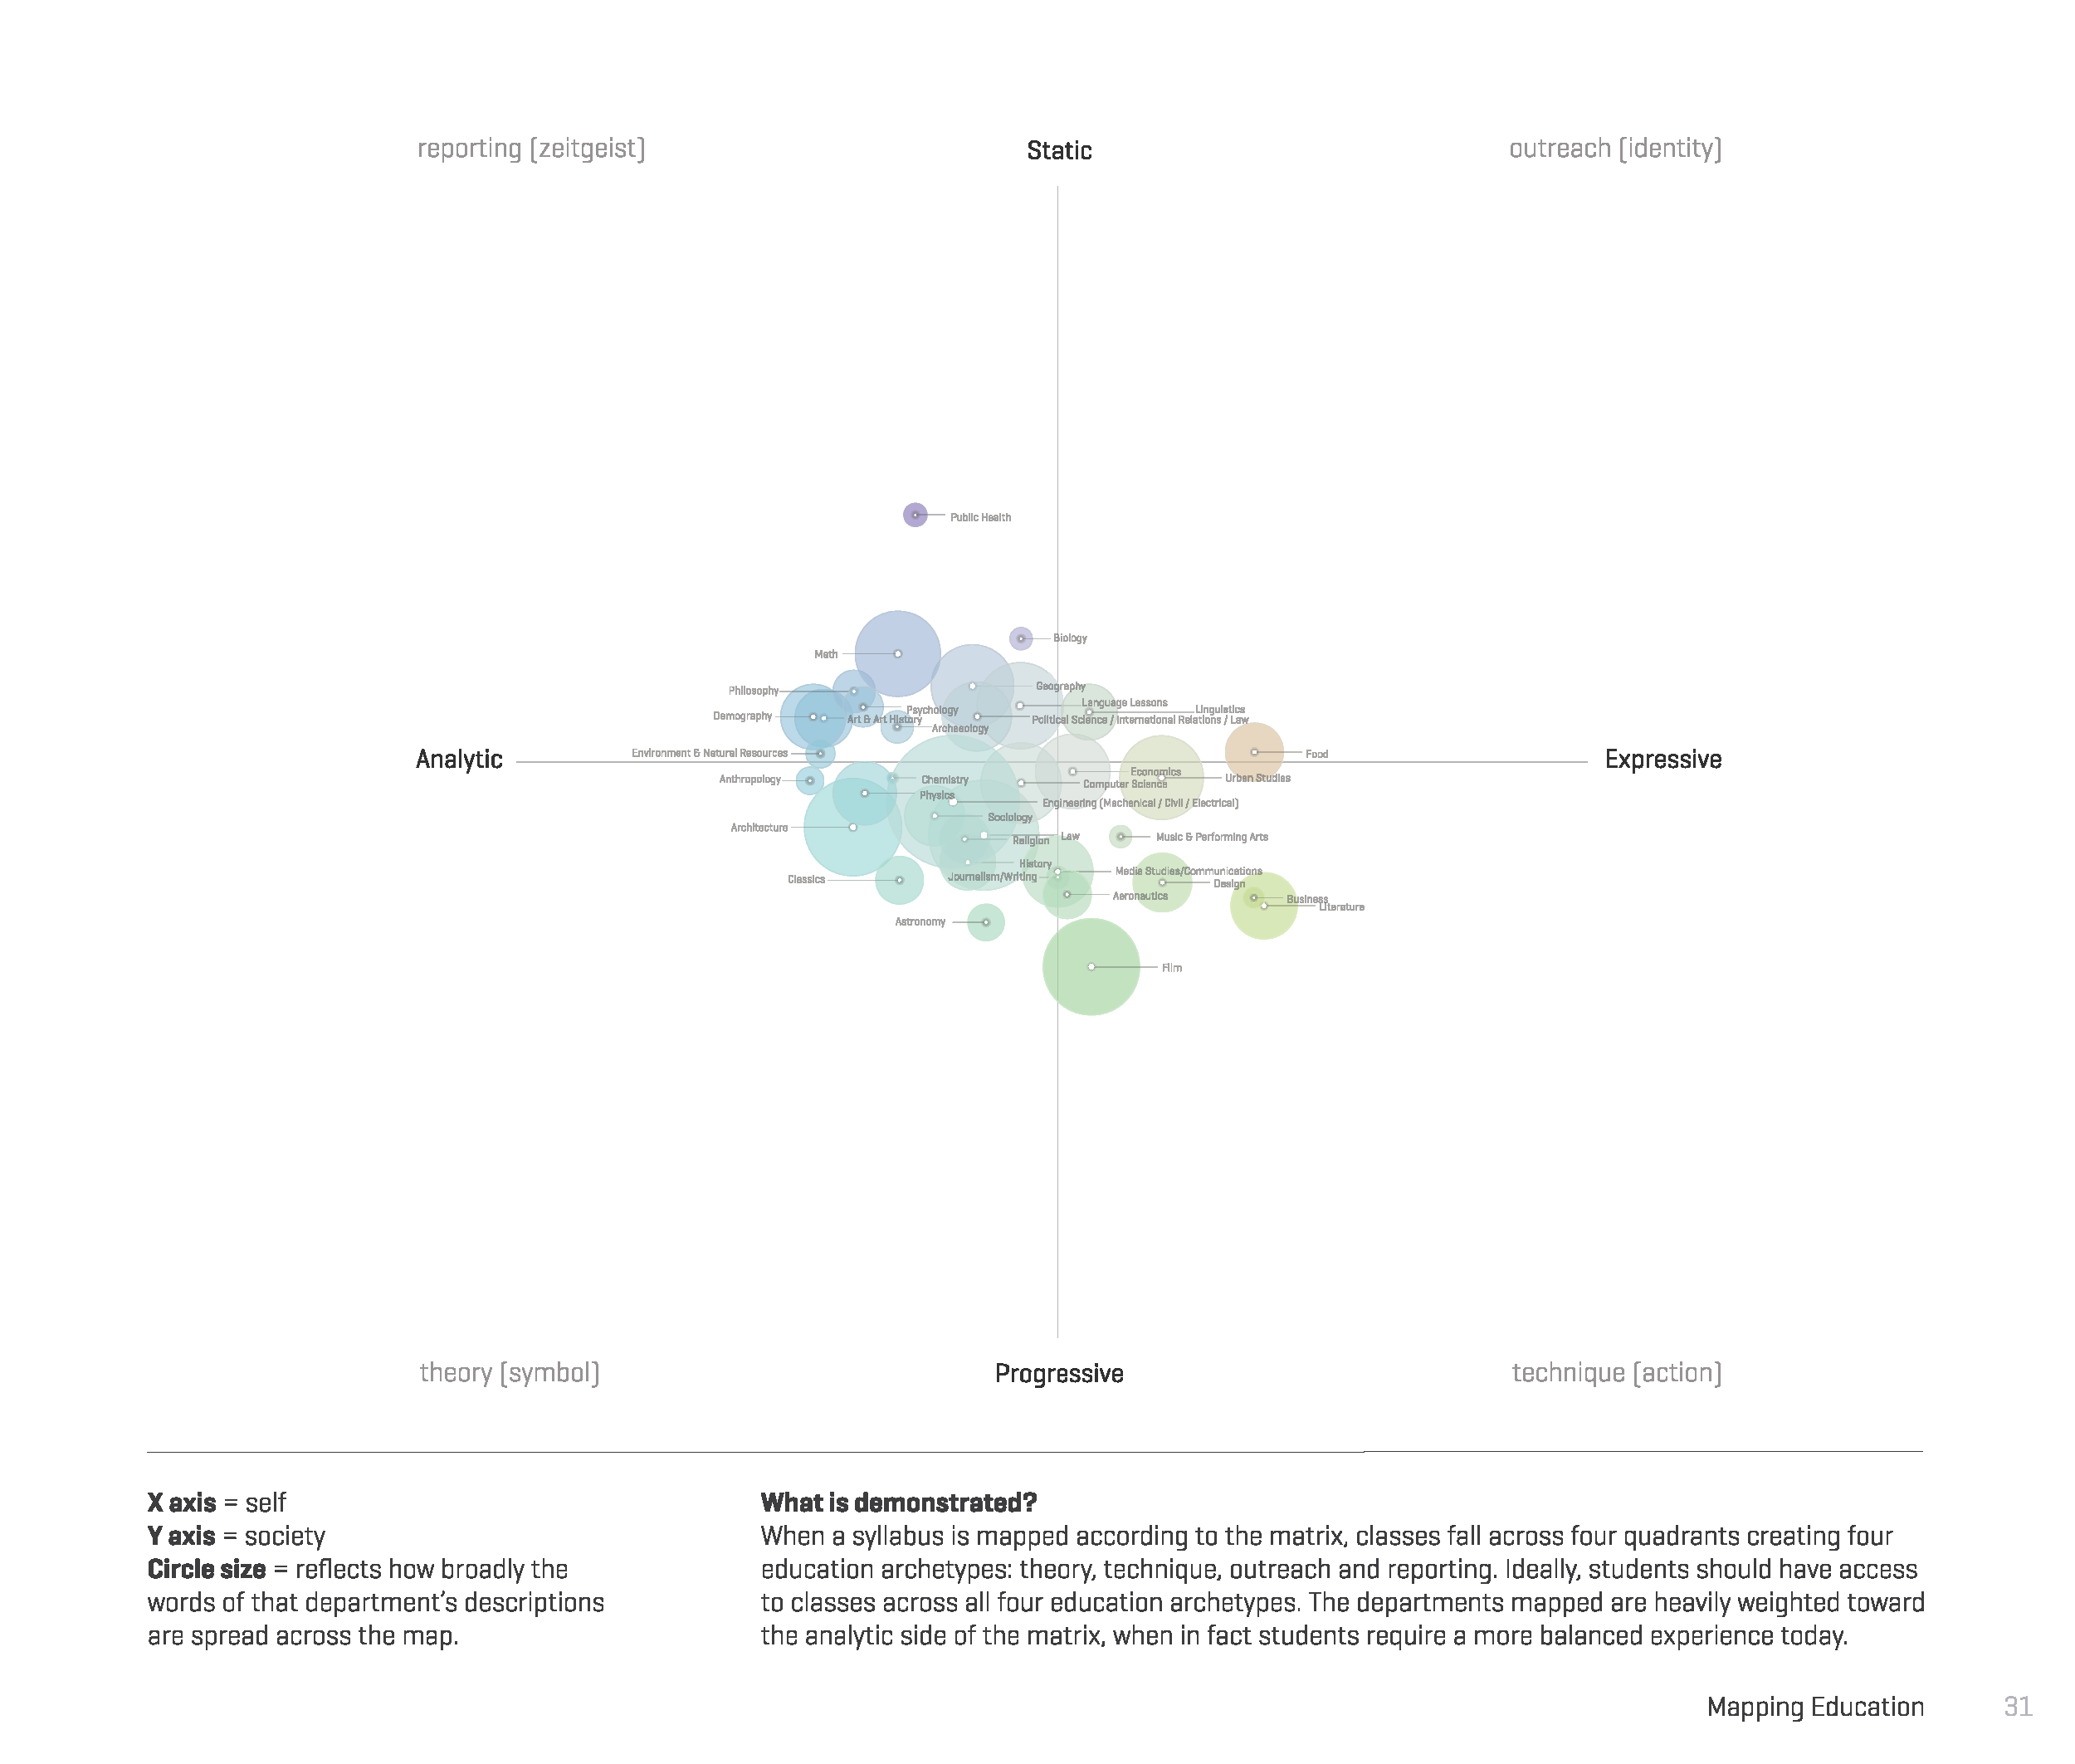
Our Culture Mapping patent allows us to input a broad range of open and closed text data sets that are measured and plotted using our machine learning algorithm. The patterns of explicit and implicit meaning reveal cultural narrative patterns of change.
We are able to scrape any text data as a corpus for analysis. That includes social media sources as well as closed sources such as books and speeches as well as internal resources such as call center data or stakeholder interviews. We mine from 2500 to 10,000 conversation entries for linguistic relevance. We seek the most impactful data that can be organized into meaningful packets of information that are powerful and discrete and can be applied to larger schematics. Our mapping capability allows for efficiency in research design. making deeper dives more compelling and cutting faster to more precise answers. Mapping also allows for layers of information from various sources to be placed in context over time. It also informs future fieldwork and recruitment.
Academic Journals: Pre-emptive Culture Mapping: Exploring a System of Language to Better Understand the Abstract Traits of Human Interaction (Springer Science) | Mapping Abstract Futures (Academy for Design Innovation Management) | The Epidemiology of Innovation (Springer) | Common denominators: what unites global youth? (Emerald Insights) | Admap/WARC
VISUALIZING FOOD & BEVERAGE TRENDS
We have created a culture map of food conversation. Culture Mapping (developing codes and archetypes) helps us understand and explain what is going on. From 10,000 tweets, we have pulled together the most insightful, provocative and curious tweets from about 50 renowned names in the worldwide food industry, as well as other leaders who are not well-known but propel the dialog. We also cross-correlate this with Instagram and News Feeds as well as Google Trends to track the rise and fall of cultural signifiers. Read summary article
AnalyZING Beauty TrenDS
To understand what is happening within the beauty category, we compared two sets of data. One, a body of global tweets over three months of time where tweeters were discussing the latest beauty brands, techniques and tips. Second, we tested four lines of discourse to see where global perception of beauty actually lies absent of the brand conversation. Two different trajectories exist. Read summary article
ANALYZING Buckminster Fuller
Using Culture Mapping Data Visualization (click on this link to go to interactive visualization dashboard) to analyze the transcripts of Buckminster Fuller’s Everything I Know, a 42-hour thinking-out-loud lecture series videotaped in 1975. To get to the bottom of the issue, we processed the Everything I Know transcripts using natural language processing to identify and score potential signifiers from Bucky’s words session by session. Based on the signifiers, his sessions walk us through framework, investigation, instrumentation, calibration, systematizing, trim tabbing, conspiring, orchestration, realization, investment, principles, vision. Read article
ANALYZING Trump’s First 100 Days
Using Culture Mapping Data Visualization (click on this link to go to interactive visualization dashboard) to analyze the transcripts of Buckminster Fuller’s Everything I Know, a 42-hour thinking-out-loud lecture series videotaped in 1975. To get to the bottom of the issue, we processed the Everything I Know transcripts using natural language processing to identify and score potential signifiers from Bucky’s words session by session. Based on the signifiers, his sessions walk us through framework, investigation, instrumentation, calibration, systematizing, trim tabbing, conspiring, orchestration, realization, investment, principles, vision. Read article


